View a planform
DataCube
>>> golfcube = spl.sample_data.golf()
>>> final = spl.plan.Planform(golfcube, idx=-1)
You can visualize the data yourself, or use the built-in show() method of a Planform.
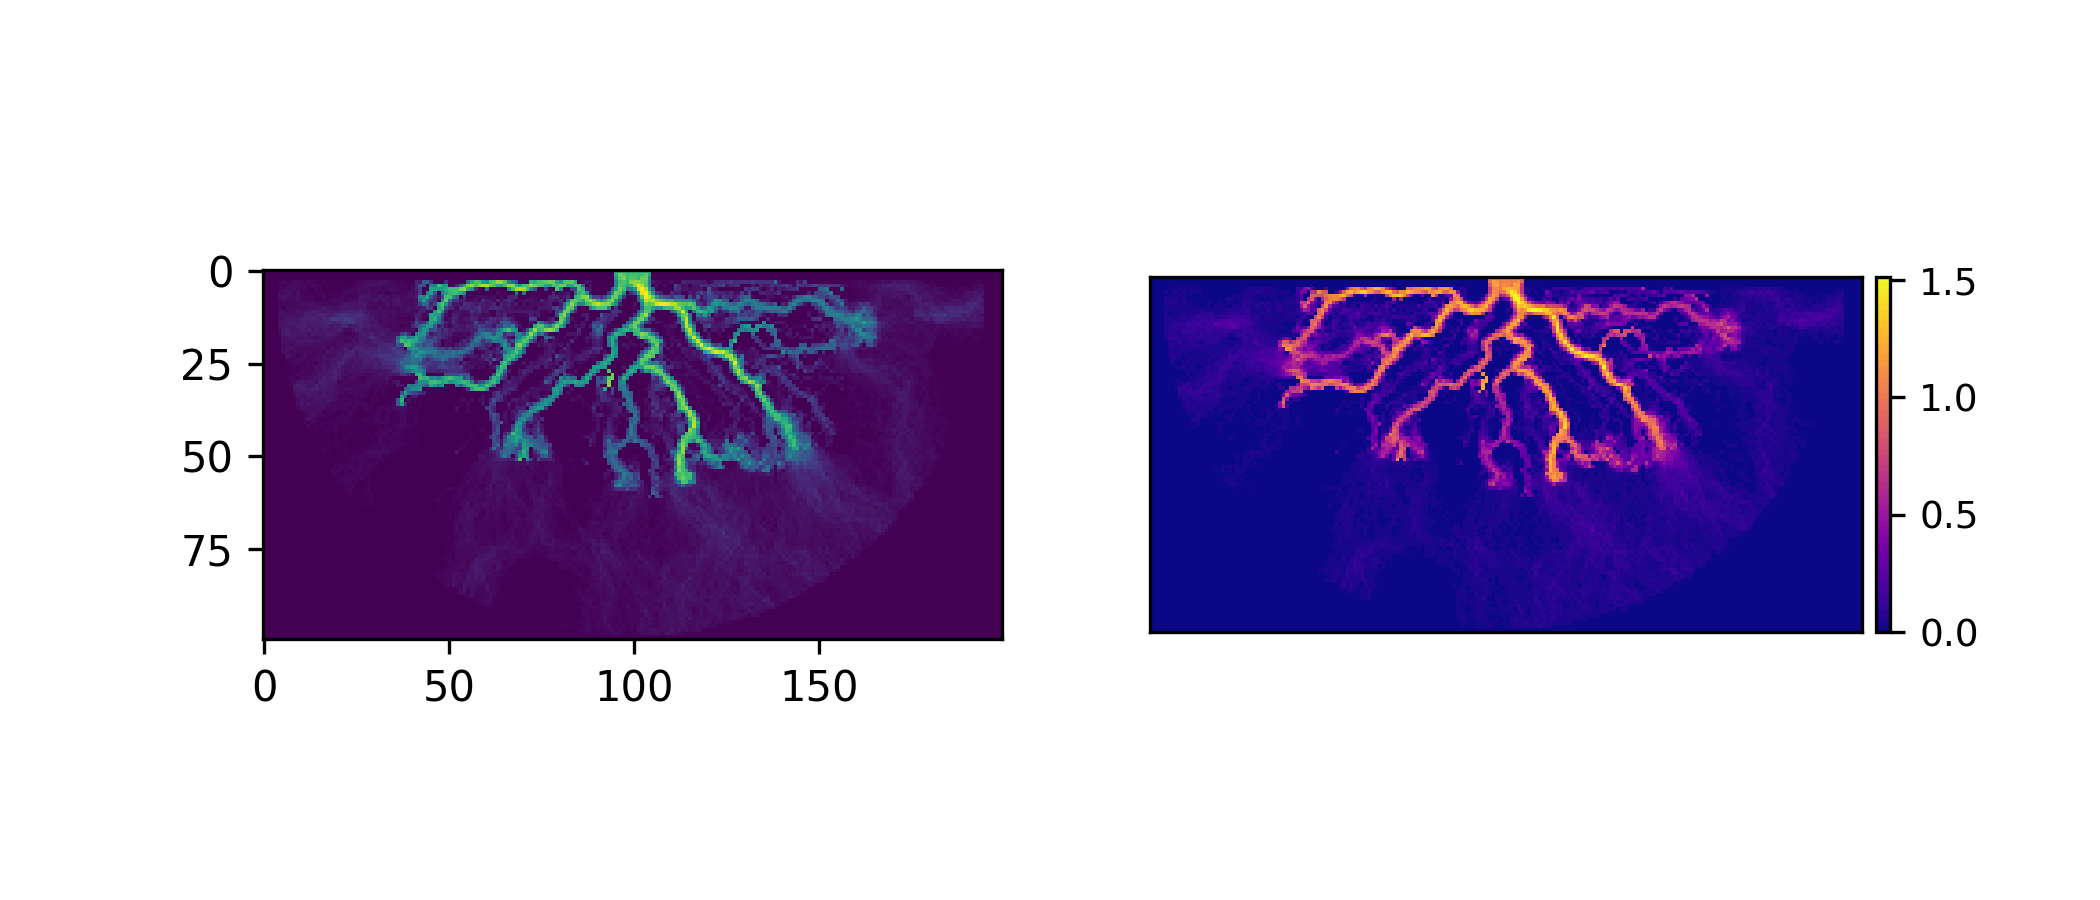
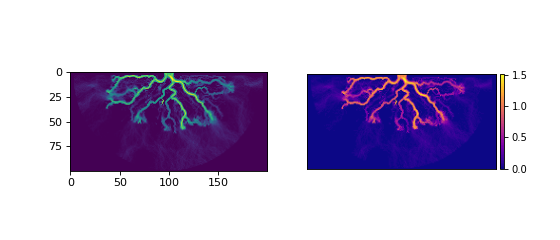
>>> fig, ax = plt.subplots(1, 2, figsize=(7, 3))
>>> ax[0].imshow(final["velocity"])  # display directly
>>> final.show("velocity", ax=ax[1])  # use the built-in show()
>>> plt.show()
(Source code, png, hires.png)
StratigraphyCube
>>> golfstrat = spl.cube.StratigraphyCube.from_DataCube(golfcube, dz=0.1)
>>> minus1 = spl.plan.Planform(golfstrat, z=-1)
You can visualize the data yourself, or use the built-in show() method of a Planform.
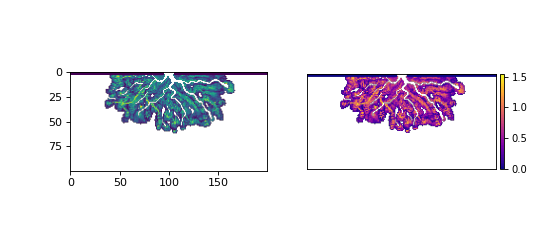
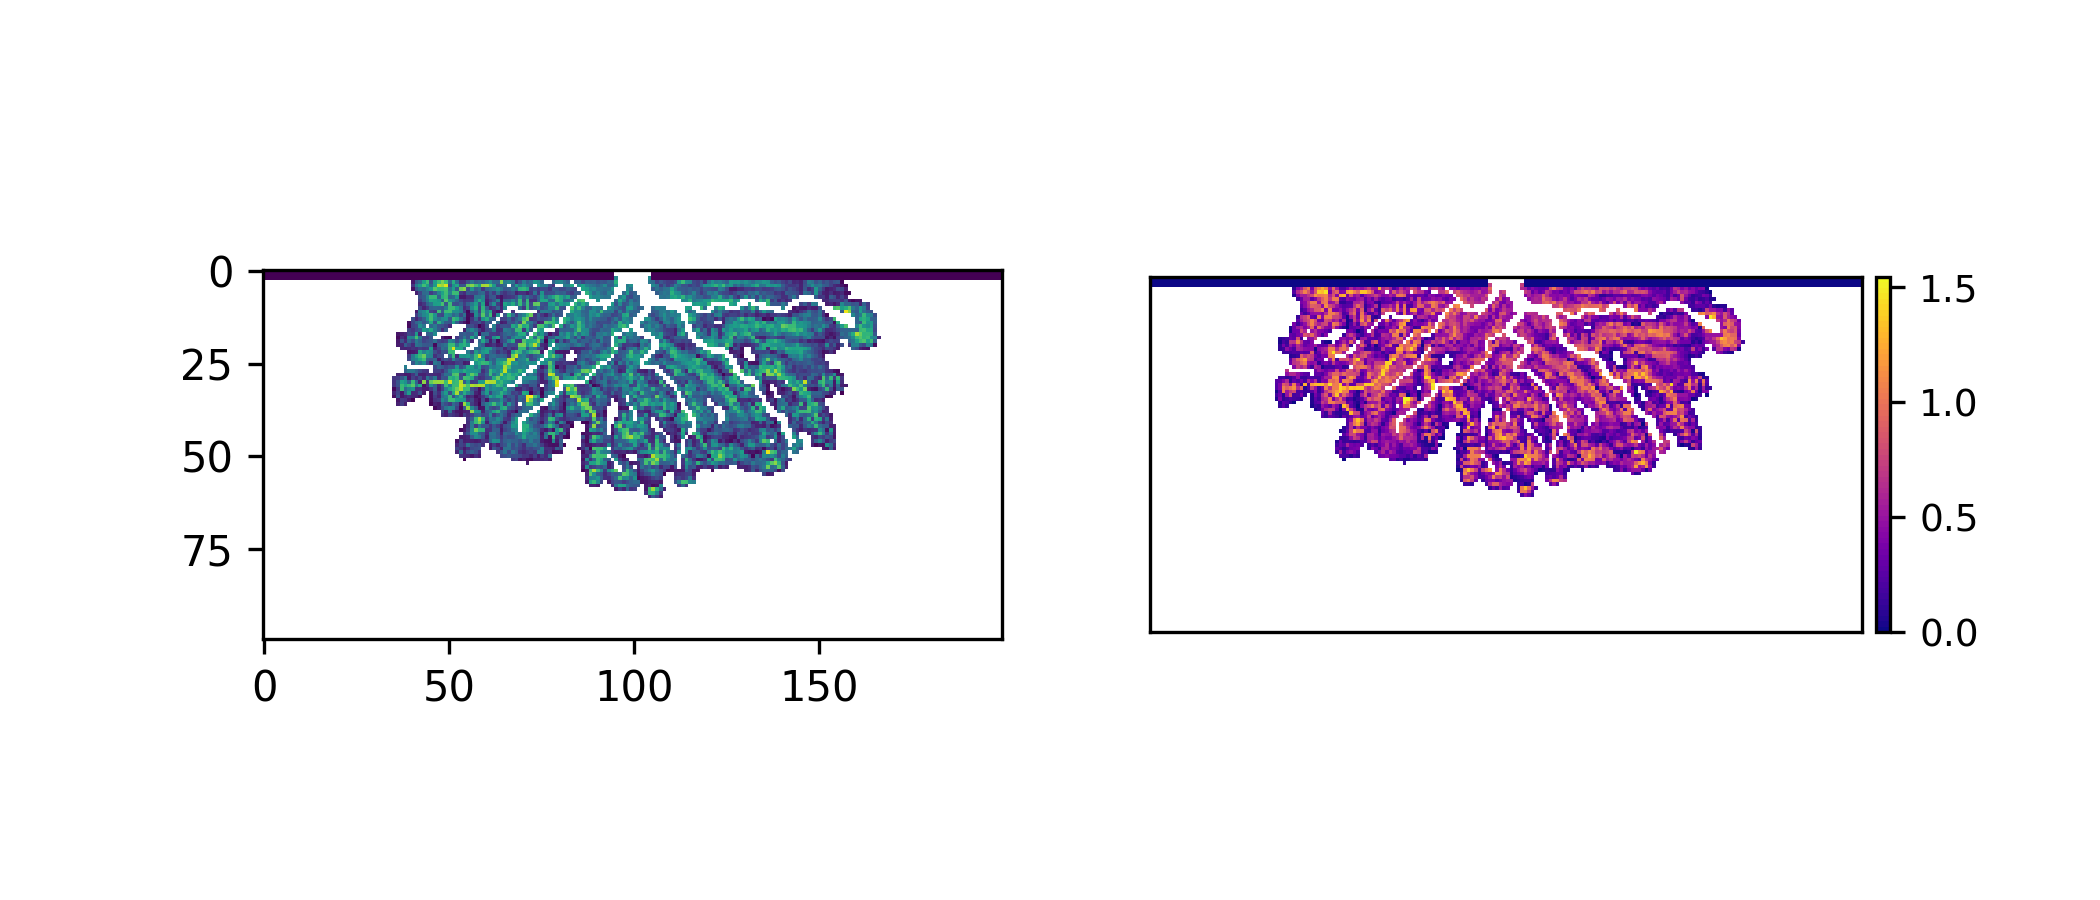
>>> fig, ax = plt.subplots(1, 2, figsize=(7, 3))
>>> ax[0].imshow(minus1["velocity"])  # display directly
>>> minus1.show("velocity", ax=ax[1])  # use the built-in show()
>>> plt.show()
(Source code, png, hires.png)

See also
- Introduction to Planform objects
Subject guide on Planform operations and classes
- Visualization Guide
Subject guide on visualization in sandplover