sandplover.plan.compute_shoreline_distance
- sandplover.plan.compute_shoreline_distance(shore_mask, origin=(0, 0), return_distances=False)
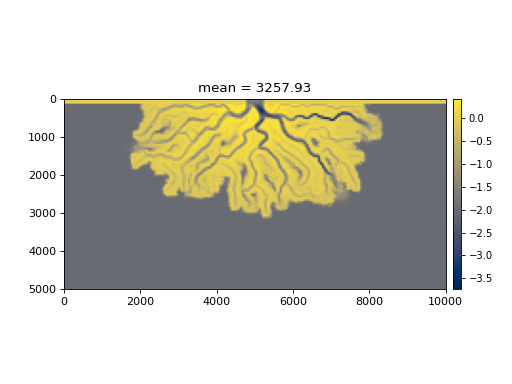
Compute mean and stddev distance from the delta apex to the shoreline.
Algorithm computes the mean distance from the delta apex/origin to all shoreline points.
Important
This calculation is subtly different than the “mean delta radius”, because the measurements are not sampled evenly along the opening angle of the delta.
Note
uses np.nanmean and np.nanstd.
Changed in version 0.5: The expected order of dimensions in the origin keyword parameter has switched. This is now consistent with other uses of this keyword, expecting the tuple to be ordered (dim1, dim2).
- Parameters:
shore_mask (
ShorelineMask,ndarray) – Shoreline mask. Can be aShorelineMaskobject, or a binarized array.origin (
tuple,np.ndarray, optional) – Origin from which the distance to all shoreline points is computed, specified in data dimensions (not indices) along dim1, dim2 of the data. Default (0, 0).return_distances (
bool) – Whether to return the sorted line as a second argument. If True, aNx2array of x-y points is returned. Default is False.
- Returns:
mean (
float) – Mean shoreline distance.stddev (
float) – Standard deviation of shoreline distance.distances (
np.ndarray) – Ifreturn_distancesis True, then distance to each point along the shoreline is also returned as an array (i.e., 3 arguments are returned).
Examples
>>> from sandplover.mask import ShorelineMask
>>> from sandplover.plan import compute_shoreline_distance
>>> from sandplover.sample_data.sample_data import golf
>>> golf = golf()
>>> sm = ShorelineMask(
...     golf["eta"][-1, :, :], elevation_threshold=0, elevation_offset=-0.5
... )
Compute mean and stddev distance
>>> mean, stddev = compute_shoreline_distance(
...     sm, origin=[golf.meta["L0"].data, golf.meta["CTR"].data]
... )
Make the plot
>>> import matplotlib.pyplot as plt
>>> fig, ax = plt.subplots()
>>> golf.quick_show("eta", idx=-1, ticks=True, ax=ax)
>>> dx = golf.meta["dx"].data
>>> origin_x = golf.meta["CTR"].data * dx
>>> origin_y = golf.meta["L0"].data * dx
>>> _ = ax.plot(origin_x, origin_y, "ro")
>>> _ = ax.set_title("mean = {:.2f}".format(mean))
(
Source code,png,hires.png)