sandplover.plan.compute_shoreline_length
- sandplover.plan.compute_shoreline_length(shore_mask, start=(0, 0), origin=None, return_line=False)
Compute the length of a shoreline from a mask of the shoreline.
Algorithm attempts to determine the sorted coordinates of the shoreline from a
ShorelineMask.Warning
Imperfect algorithm, which may not include all True pixels in the ShorelineMask in the determined shoreline.
Changed in version 0.5: Changed keyword origin to start.
With v0.5 the input keyword argument origin is deprecated, and replaced with keyword argument start.
- Parameters:
shore_mask (
ShorelineMask,ndarray) – Shoreline mask. Can be aShorelineMaskobject, or a binarized array.start (
tuple,np.ndarray, optional) – Determines the location from where the starting point of the line sorting is initialized. The starting point of the line is determined as the point nearest to start. For non-standard data configurations, it may be important to set this to an appropriate value. Default is (0, 0).return_line (
bool) – Whether to return the sorted line as a second argument. If True, aNx2array of x-y points is returned. Default is False.
- Returns:
length (
float) – Shoreline length, computed as described above.line (
np.ndarray) – Ifreturn_lineis True, the shoreline, as anNx2array of x-y points, is returned.
Examples
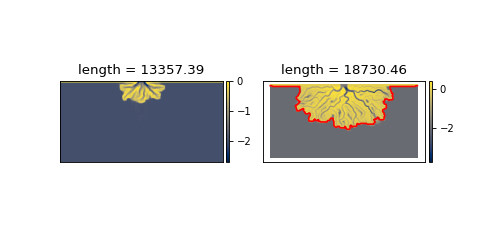
Compare the length of the shoreline early in the model simulation with the length later. Here, we use the elevation_offset parameter (passed to
ElevationMask) to better capture the topography of the pyDeltaRCM model results.>>> from sandplover.mask import ShorelineMask >>> from sandplover.plan import compute_shoreline_length >>> from sandplover.sample_data.sample_data import golf
>>> golf = golf()
Early in model run
>>> sm0 = ShorelineMask(
...     golf["eta"][15, :, :], elevation_threshold=0, elevation_offset=-0.5
... )
Late in model run
>>> sm1 = ShorelineMask(
...     golf["eta"][-1, :, :], elevation_threshold=0, elevation_offset=-0.5
... )
Compute lengths
>>> len0 = compute_shoreline_length(sm0)
>>> len1, line1 = compute_shoreline_length(sm1, return_line=True)
Make the plot
>>> import matplotlib.pyplot as plt
>>> fig, ax = plt.subplots(1, 2, figsize=(6, 3))
>>> golf.quick_show("eta", idx=15, ax=ax[0])
>>> _ = ax[0].set_title("length = {:.2f}".format(len0))
>>> golf.quick_show("eta", idx=-1, ax=ax[1])
>>> _ = ax[1].plot(line1[:, 0], line1[:, 1], "r-")
>>> _ = ax[1].set_title("length = {:.2f}".format(len1))
(
Source code,png,hires.png)