sandplover.plan.compute_shoreline_roughness_OAM
- sandplover.plan.compute_shoreline_roughness_OAM(shore_mask_45, shore_mask_120, calculate_length=False, **kwargs)
Compute shoreline roughness, as ratio of shoreline lengths at different thresholds.
Computes the shoreline roughness metric:
\[R = N_{45} / N_{120} \approx L_{45} / L_{120}\]where R is the roughness of the shoreline, N is the number of pixels in the shoreline in the shore_mask inputs, and \(L\) is the shoreline length (after [1]).
- Parameters:
shore_mask_45 (
ShorelineMask,ndarray) – Shoreline mask, derived from the Opening Angle Method, at the 45 degree contour. Can be aShorelineMaskobject, or a binarized array.shore_mask_120 (
ShorelineMask,ndarray) – Shoreline mask, derived from the Opening Angle Method, at the 120 degree contour. Can be aShorelineMaskobject, or a binarized array.calculate_length (bool, optional) – If calculate_length=True, then
compute_shoreline_lengthis used to calculate the length of the shoreline explicitly, rather than counting the pixels in shore_mask_45 and shore_mask_120. Default is False.**kwargs – Passed to compute_shoreline_length, if calculate_length=True.
- Returns:
roughness – Shoreline roughness, computed as described above.
- Return type:
float
Examples
Calculate the shoreline roughness.
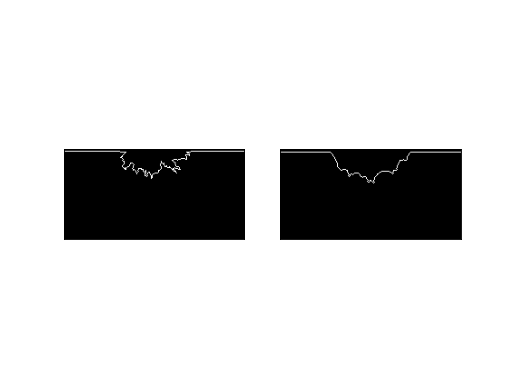
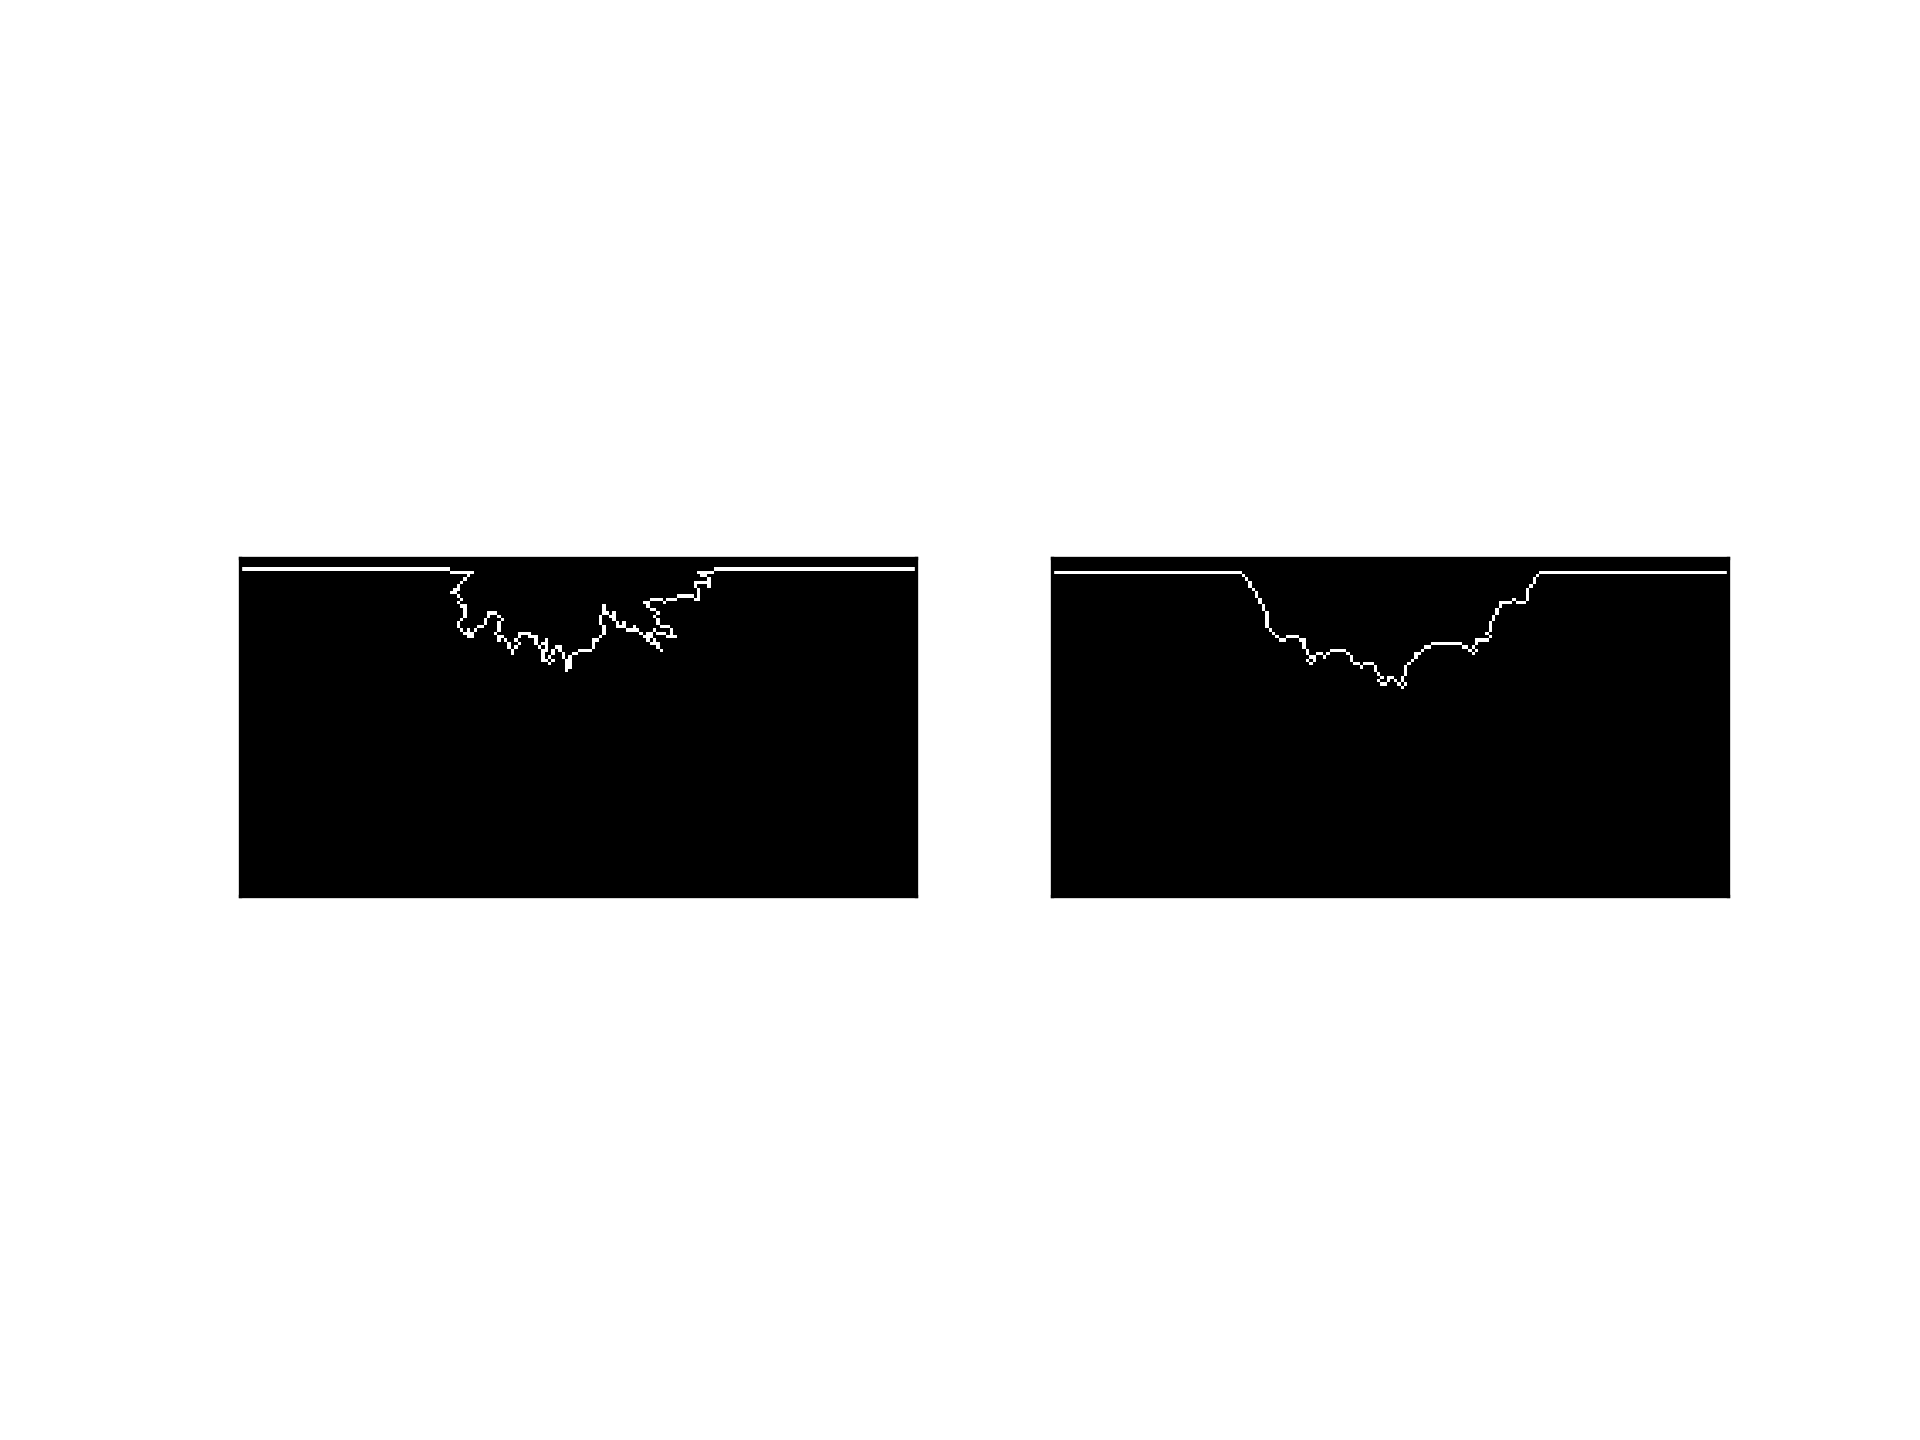
from sandplover.plan import compute_shoreline_roughness_OAM

golf = spl.sample_data.golf()
origin = (
    np.array([golf.meta["L0"].data, golf.meta["CTR"].data])
    * golf.meta["dx"].data
)

em = spl.mask.ElevationMask(
    golf["eta"][30, :, :], elevation_threshold=0, elevation_offset=-0.1
)
em.trim_mask(length=golf.meta["L0"].data + 1, value=1)
oam = spl.plan.OpeningAnglePlanform.from_mask(em)

sm45 = spl.mask.ShorelineMask.from_Planform(oam, contour_threshold=45)
sm120 = spl.mask.ShorelineMask.from_Planform(oam, contour_threshold=120)

fig, ax = plt.subplots(1, 2)
sm45.show(ax=ax[0])
sm120.show(ax=ax[1])
plt.show(block=False)
(
Source code,png,hires.png)
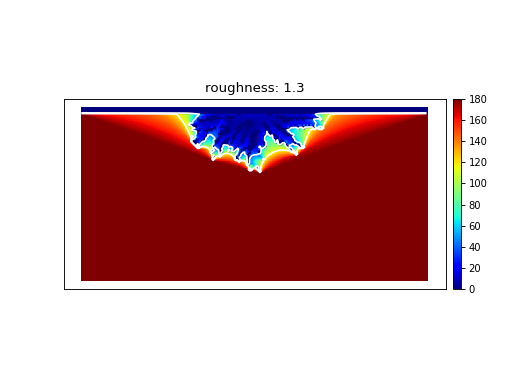
roughness_oam = compute_shoreline_roughness_OAM(sm45, sm120)

fig, ax = plt.subplots()
oam.show(ax=ax)
ax.contour(
    oam.opening_angles.y,
    oam.opening_angles.x,
    oam.opening_angles,
    levels=[45, 120],
    colors=["w"],
)
ax.set_title(f"roughness: {roughness_oam:.1f}")
plt.show()

See also
See this example, which compares all of the “shoreline roughness” metrics implemented in sandplover.