sandplover.plan.compute_topset_slope
- sandplover.plan.compute_topset_slope(elevation_data, origin=(0, 0), elevation_threshold=0, count_threshold=5, return_slopes=False, **kwargs)
Compute the slope of a fan or delta topset.
Algorithm uses equally spaced
RadialSectionto calculate the slope of input elevation_data that is above elevation_threshold.- Parameters:
elevation_data (array-like) – Input elevation data.
origin – Origin for
RadialSectionobjects, specified in data dimensions (not indices) along dim1, dim2 of the data. Default (0, 0).elevation_threshold (float, optional) – Elevation threshold for finding the topset. Commonly, this would be sea level. Default is 0.
count_threshold (int, optional) – How many pixels above sea level must be identified in order to fit a line. Default is 5 points.
return_slopes (bool, optional) – Whether to return the calculated slopes, in addition to the mean and standard deviation.
**kwargs – Passed to
_determine_equally_spaced_azimuths.
- Returns:
mean – Mean slope along all sections.
std – Standard deviation of slope along sections.
slopes – Array of slope values calculated along all sections. Returned only if return_slopes = True.
Examples
See also
See also some examples using compute_topset_slope in computations here: Radially-averaged topset slope.
To make a calculation with 5 equally spaced sections on the left half of the domain only:
>>> from sandplover.sample_data.sample_data import golf
>>> from sandplover.section import RadialSection
>>> from sandplover.plan import compute_topset_slope
>>> golf = golf()
>>>
>>> azimuth_kwargs = {"num": 5, "start": 90, "end": 180}
>>> origin = (
...     np.array([golf.meta["L0"].data, golf.meta["CTR"].data])
...     * golf.meta["dx"].data
... )
>>> mean_slope, std_slope = compute_topset_slope(
...     golf["eta"][-1, :, :], origin=origin, **azimuth_kwargs
... )
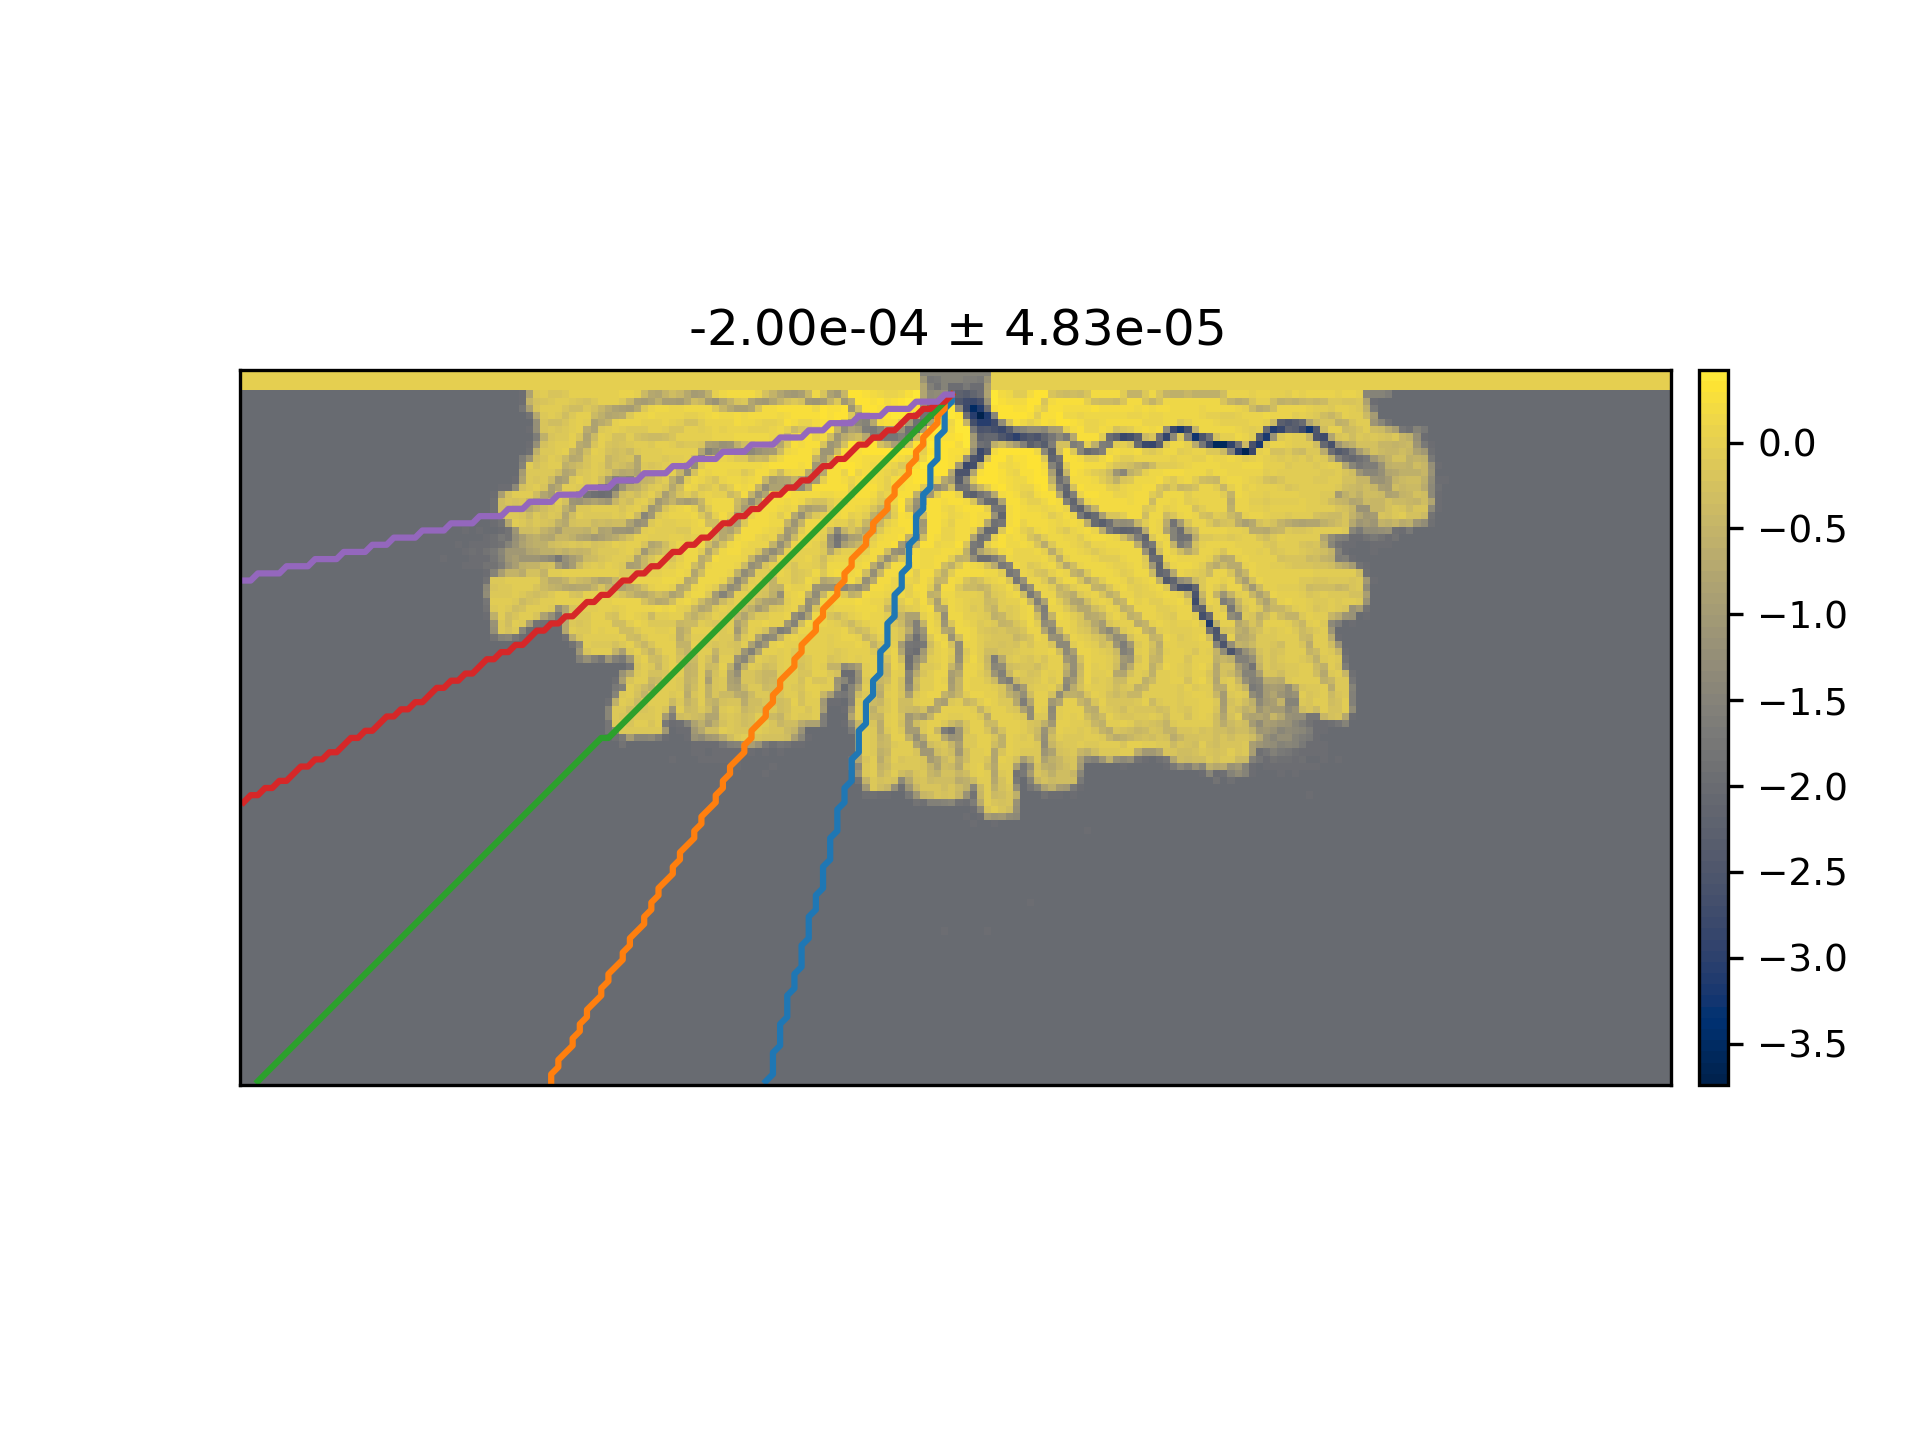
>>> # below is to visualize the sections
>>> from sandplover.plan import _determine_equally_spaced_azimuths
>>> azimuths = _determine_equally_spaced_azimuths(**azimuth_kwargs)
>>>
>>> fig, ax = plt.subplots()
>>> golf.quick_show("eta", -1)
>>>
>>> for a, azimuth in enumerate(azimuths):
...     a_section = RadialSection(
...         golf["eta"][-1, :, :],
...         azimuth=azimuth,
...         origin=origin,
...     )
...
...     a_section.show_trace(ax=ax)
...
>>>
>>> _ = ax.set_title(f"{mean_slope:.2e} $\pm$ {std_slope:.2e}")
(
Source code,png,hires.png)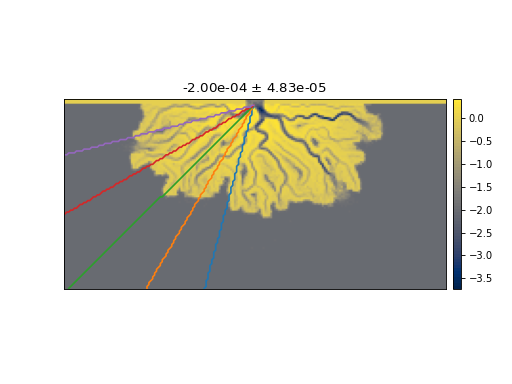
To calculate the slope of a deposit, try something like:
>>> deposit_thickness = golf["eta"][-1, :, :] - golf["eta"][0, :, :]
>>> deposit_thickness.data[deposit_thickness == 0] = np.nan
>>> mean, std = compute_topset_slope(
...     deposit_thickness, elevation_threshold=-np.inf
... )